What is it?
A few years ago I had an idea for a desktop app. The idea was that I’d create a simple web browser with UI similar to the ‘Inspect Element’ functionality in Safari, and allow you to select specific regions (divs) within web pages that you are interested in. Then you could lay out those elements on your own blank page in any configuration, and set refresh intervals for each component. The app would fetch updated versions of all the different news headlines, weather forecasts, or any other data, and lay it all out without any ads and in the format the user wants.
I never made this, and I’m not even sure it would be possible. It has some ethical issues, given you’re circumventing advertising and taking data. And it has many technical and user interface issues too. So I guess I just never decided to dive in and do it.
But I have just finished making a sort of prototype. I wanted a noticeboard for the kitchen. A calendar, news feed, weather forecast, surf forecast and web cam all in one, filled with data from many different sources. I don’t think anyone has yet made that app idea that I had, so I wrote a bunch of ruby scripts and got it working for my specific use case in a few hours.
This is what I have ended up with:
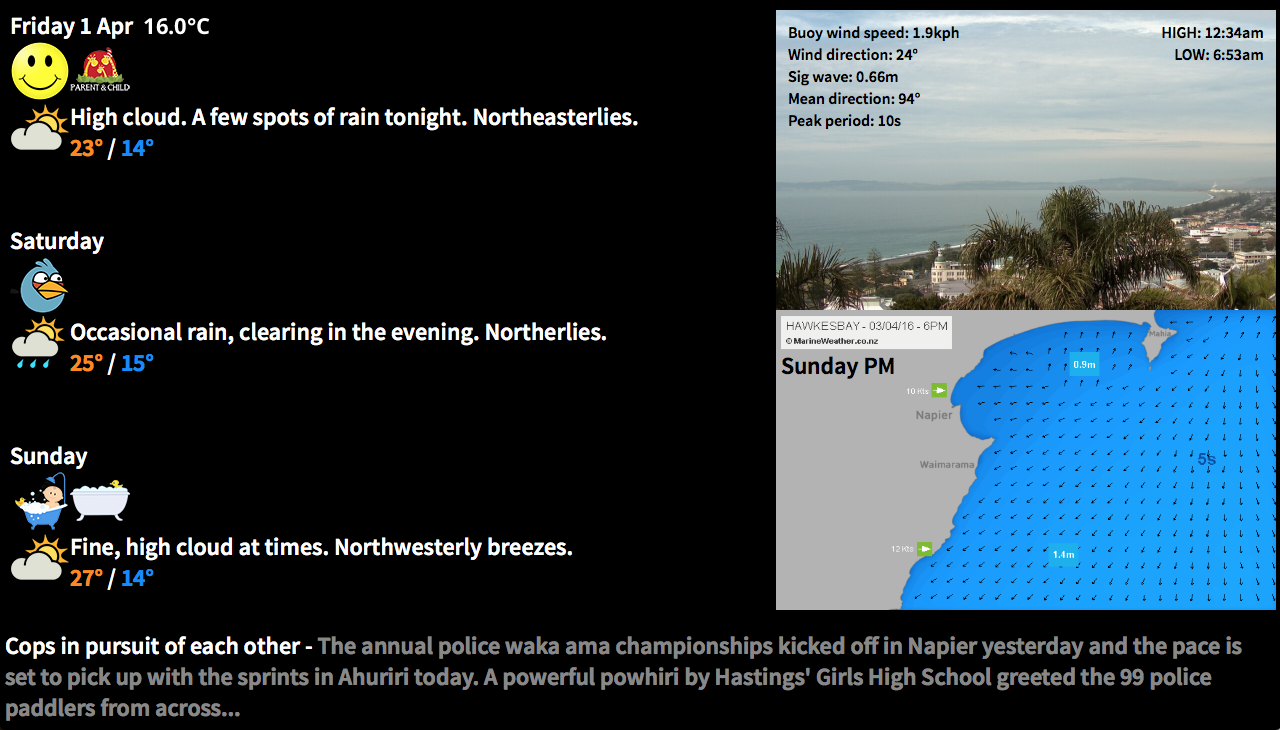
It sources data from the local weather service, a web cam, an animated marine forecast model, a buoy, a news feed, and my own set of recurring events mostly relating to the kids. I display all of this on a TV in the kitchen, and everything is running on a Raspberry Pi which displays the results directly to the TV via the pi’s HDMI output.
I’m not going to make this totally open source, as it would require a bunch more work for me, and currently it’s extremely specific to my use. I also don’t want to reveal the exact data sources I used out of respect for the sites I’m scraping from, so will replace URLs with hashes. I should also say here that you too really must respect your data sources, or you may well find yourself on a black list. I’m careful to only pull the data as often as needed, and to test with data I cache locally. Doing this sort of thing is against the terms of use for most sites, and it could all stop working at any point, especially if you abuse it.
The Script
At a high level, it’s a ruby script that scrapes data and outputs an index.html and a few images and data caches. Then any web browser can display the results. I chose ruby as I nearly always do, I’m familiar with ruby and it’s a good fit for this kind of thing. The ruby script is run from the cron every 10 minutes, and the page is also set to auto-refresh every 10 minutes.
The script requires json and xml-simple gems, as well as net/http
require 'rubygems'
require 'net/http'
require 'json'
require 'xmlsimple'
One of my data sources does this thing where it redirects you to a session-specific url, so I had to handle redirects correctly. I found how to do this in the Ruby documentation.
def fetch(uri_str, limit = 10)
  return nil if limit == 0

  response = Net::HTTP.get_response(URI(uri_str))

  case response
  when Net::HTTPSuccess then
    response
  when Net::HTTPRedirection then
    location = response['location']
    #warn "redirected to #{location}"

    fetch(location, limit - 1)
  else
    response.value
  end
end
JSON Data
The first data I tried to get was the weather data. I initially intended to just scrape it from the HTML, but I found that it wasn’t actually there when you first grab the page, it’s populated later. I was about ready to pull out Charles Proxy to find out exactly where the data was coming from, but then found I could see the raw data quite easily using the developer tools built into Safari. In the timeline tab you can see every individual resource, and then find its direct URL. This gave me URLs for all of the individual weather data blobs, which were mostly in JSON format.
forecast_uri = 'http://####.com/localForecasthastings'
forecast_response = fetch(URI.parse(forecast_uri))
forecast_json = forecast_response.body
File.write('../public/data/forecast.json', forecast_json) #pulled and cached once an hour, otherwise it is read from the cache


forecast_parsed = JSON.parse(forecast_json)
This forecast data can then be used pretty easily to display however you want. There was a field named ‘forecastWord’ in the data, and I cut up icons and named them in such a way it was easy to display the correct one. The full forecast display is like this:
day_json = forecast_parsed["days"][0]
weather_icon_url = "img/#{day_json["forecastWord"]}.png"
output_html += "<div style=\"float:left;\"><img src=\"#{weather_icon_url}\"/></div>"
output_html += "<div>#{day_json['forecast']}<br>"
output_html += "<font color=\"#ff8800\">#{day_json['max']}°</font> / <font color=\"#0088ff\">#{day_json['min']}°</font></div><br><br>"I also used JSON for my own recurring data. I just hand wrote a JSON file that had event names for each day, as well as some periodical events which occur ever X days. Then it does something similar to the weather icon thing and just looks for an icon filename matching the event name.
Image Data
This bit was pretty easy. There was a particular webcam image I wanted to display, so I initially tried just sticking the URL of the webcam image into an img src, however I got nothing, I presume they had disabled hotlinking. This was probably best anyway, I should be pulling the image once and caching it, then displaying it from the local cache, so that’s what I did. I displayed it as a background image so I could overlay a table containing the buoy data.
if time.hour > 5 and time.hour < 19 then #only fetch during daylight hours, as the webcam doesn't update anyway

    webcam_uri =  'http://####/webcamImage.jpg'
    webcam_response = fetch(URI.parse(webcam_uri))
    webcam_data = webcam_response.body
    File.write('../public/data/webcam.jpg', webcam_data)
end

output_html += "<div style=\"color:black;width:500px;height:300px;background-repeat:no-repeat;background:#000 url('data/webcam.jpg'); background-size: 640px 300px;\">"
There was a series of marine model maps, which I found I could download by asking for file names with a simple string based on the date. I then animate them using Cycle2. This was one of the tricker things actually, jQuery is always a bit fussy for me, and I had difficulty displaying captions over the images (I wanted large day name titles for each image). But I got there in the end by using a slideshow of divs.
output_html += "<div class=\"cycle-slideshow\"
style=\"height:300px;\"
    data-cycle-fx=none
    data-cycle-speed=10
    data-cycle-auto-height=\"500:300\"
    data-cycle-slides=\"> div\">"
mwCounter = 0
while mwCounter < 7 do
    if mwCounter == 0 then
        dayName = "Today"
    elsif mwCounter == 1 then
        dayName = "Tomorrow"
    else
        dayName = forecast_parsed["days"][mwCounter]['dow']
    end

    output_html += "<div style=\"color:black;width:500px;height:300px;background-repeat: no-repeat;background:#000 url('data/mw_#{mwCounter}_am.png'); background-size: 500px 300px;\">"
    output_html += "<div style=\"padding-left:5px;padding-top:40px;\">#{dayName} AM</div></div>"

    output_html += "<div style=\"color:black;width:500px;height:300px;background-repeat: no-repeat;background:#000 url('data/mw_#{mwCounter}_pm.png'); background-size: 500px 300px;\">"
    output_html += "<div style=\"padding-left:5px;padding-top:40px;\">#{dayName} PM</div></div>"

    mwCounter += 1
end
output_html += "</div>"
I also found that the only way I could get the latest observed temperature reading was as an image too, so I downloaded that in the same way. It had to be cropped, so I did this with some CSS.
output_html += "<img style=\"position: absolute;top:-98px;clip: rect(113px,130px,135px,0px);\" src=\"data/obs_image.png\"/><br>"HTML Data
One of my data sources was simply an HTML table. I used regular expressions to pull out the data so I could then display it in my own table. I also converted knots to kph while I was at it.
bouy_windSpeed = sprintf('%.1f', /Wind Speed :([^<]*)/.match(bouy_data).captures[0].to_i * 1.852)
bouy_windDir = /Wind Direct :([^<]*)/.match(bouy_data).captures[0]
bouy_sigWave = /Sig Wave :([^<]*)/.match(bouy_data).captures[0]
bouy_swellDir = /Mean Direct :([^<]*)/.match(bouy_data).captures[0]
bouy_swellPeriod = /Peak Period :([^<]*)/.match(bouy_data).captures[0]
RSS Feed
Finally I wanted to display a news feed, and found a good RSS feed for a local news source. I used a different jQuery script - tCycle for this slideshow/ticker, as I had done this before I found Cycle2, and it seems to do the trick.
news_hash = XmlSimple.xml_in(news_rss_data)

output_html += "<div class=\"ticker-container\">
  <ul>"

article = 0
while article < news_hash['channel'][0]['item'].length do
title = news_hash['channel'][0]['item'][article]['title'][0]
desc = news_hash['channel'][0]['item'][article]['description'][0]

output_html += "<div><li>#{title} - <font color=\"#888\">#{desc}</font></li>
    </div>"
article += 1
end

output_html += "</ul>
</div>
Getting it all working on the Raspberry Pi
Initially I developed this on a Mac, and was using Chrome and casting the web view to a Chromecast plugged into the TV. This was fine for development, however it isn’t a great long term solution. Casting required manually selecting the Chromecast device every time there was a disconnect, my desktop had to stay on with the script running, and it used a bunch more WiFi bandwidth than necessary.
So it seemed a perfect use case for a Raspberry Pi. I’ve never even seen a Pi before, so it was a neat excuse to finally get one. I ordered a Raspberry Pi 3, and when it got here I stuck the OS on an SD card and I was away.
I used RVM to install Ruby. For a while this caused issues when I tried running ruby scripts from the cron or the like, because you couldn’t simply call ‘ruby’ but needed to use a wrapper, see this page. But once I figured that out that part of it was pretty smooth. There was already an old Ruby installed by the OS, and I should have tried just using that.
I decided to install apache, and serve the web page properly so I could also view it from any device. That was really straight forward, I had no issues there.
Then I had to actually display the output, in full screen, and also automatically after a reboot. This was painful, but I finally have a workable solution. I’m using the Epiphany browser that comes with the RaspberryPi OS ‘Raspbian’. I found that the browser crashes fairly frequently, and the easiest solution for me was simply to kill it and restart it every 20 minutes.
So the crontab looks like this:
SHELL=/bin/bash

@reboot /home/pi/reboot.sh

5,15,25,35,45,55 * * * * /home/pi/.rvm/wrappers/ruby-2.3.0@global/ruby  /home/pi/junglenews/scripts/generate.rb &>> /home/pi/junglenews/generate.log

10,30,50 * * * * /home/pi/restartWeb.sh
reboot.sh simply starts the browser after the pi starts, and restartWeb.sh is what kills and restarts the browser every 20 minutes.
restartWeb.sh:
#!/bin/sh


killall epiphany-browser;
export DISPLAY=:0 && xset s off && epiphany-browser -a --profile /home/pi/.config http://127.0.0.1 & sleep 5s; xte "key F11" -x:0; sleep 5s; xte "key F5" -x:0
First I set the DISPLAY variable, then set the screensaver to off, which I’m not sure actually works, I set it off in two other places as you’ll see below. Then I launch the browser, it seems to need a profile in order to load a page from the command line. After it loads the page (which is hosted by apache on the pi so is at 127.0.0.1), I wait 5 seconds for the page to load before sending an F11 key command which causes it to enter full screen. Then I wait another 5 seconds before reloading the page by sending an F5 key press. This is necessary because after entering full screen the browser doesn’t layout things correctly without a refresh.
The sending key commands via xte thing uses xautomation. I found out about it all here.
I also had to set the screen resolution, hide the cursor and disable the screensaver. I changed the screen resolution to 1280x720 by editing the framebuffer width/height in /boot/config.txt as described here.
I think that simply installing unclutter hid the cursor, though I may have also needed to configure it:
sudo apt-get install unclutterTo disable the screensaver/display going to sleep, I’m not actually sure which worked, but I found some solutions on this page and did both of these:
#in /etc/lightdm/lightdm.conf


xserver-command=X -s 0 dpms

#in /etc/xdg/lxsession/LXDE/autostart


#@xscreensaver -no-splash

@xset s off
@xset -dpms
@xset s noblank
Conclusion
Part of the trigger for doing this was my desire to stop carrying my phone around while I’m at home. I tended to just pull my phone out and refresh all of these data sources (and others) far more often than necessary, and it was causing me to then be absent from the situation around me. So I ditched the phone, and it feels great. But I did miss knowing when the surf was going to be good, and what the weather was doing. This project fixed that problem perfectly.
It was a bit more work than I anticipated, in particular it was a bit of a pain wrestling with all that screensaver/cursor hiding crap. But it was totally worth it, and the results are really pretty fantastic for what I wanted. Running it on a Pi was perhaps unnecessary, but it was a good learning experience, and now it’s an all in one box that can be plugged in to any TV and ‘just work’.
…until one of the sites changes their data format, anyway!